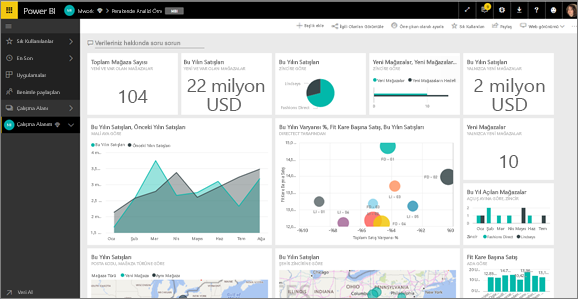
Power BI is a powerful business intelligence tool that helps you create stunning data visualizations, reports, and dashboards. By leveraging its features, businesses can gain deeper insights into their data, which leads to better decision-making and improved efficiency. In this guide, we’ll cover the core aspects of Power BI, including reporting, design customization, advanced features, interactivity, and data preparation.
Power BI Basics: Getting Started
To begin with, Power BI offers an easy-to-use interface that caters to both beginners and experts. Whether you’re using Power BI Desktop to build reports or the Power BI Service to share insights, the platform is simple to use. Additionally, Power Query allows you to transform and load data from various sources into Power BI, ensuring smooth integration. By setting up these tools, you’ll have a solid foundation for building interactive and insightful reports.
Data Preparation and Modeling: The Foundation
Next, it’s crucial to focus on data preparation and modeling. First, use Power Query to clean, transform, and merge data. This ensures consistency across all datasets. Then, with DAX (Data Analysis Expressions), you can perform advanced calculations and create custom measures. Ultimately, solid data modeling is key to ensuring accurate and reliable reporting. This step provides the foundation for creating strong, well-structured dashboards and reports.
Power BI Data Visualizations : Crafting Meaningful Insights
Now that your data is prepared, it’s time to dive into visualizations. Power BI offers a wide range of chart types, including bar charts, line charts, pie charts, and map visualizations. These visualizations make your data come alive. Furthermore, you can create custom visuals tailored to your needs, offering even more flexibility. Additionally, themes and formatting let you adjust colors and designs, making your reports not only insightful but also visually appealing.
Interactivity: Engaging Reports
In addition to visual appeal, interactivity is what makes Power BI truly stand out. For example, filters and slicers enable users to interact with data in real time, allowing them to explore and analyze different subsets of information. Moreover, cross-filtering allows for a deeper dive into the data, revealing more granular insights. With bookmarks, users can save and easily navigate between different views of the data. Together, these interactive features make reports more engaging and user-friendly.
Design and Customization: Personalizing Your Reports
When it comes to design and customization, Power BI offers numerous possibilities. You can personalize the layout, color schemes, and fonts to match your brand identity. Additionally, by incorporating custom visuals or applying unique themes, you can ensure that your reports look polished and professional. Ultimately, a well-designed report makes it easier for users to interpret the data, which leads to more informed decision-making.
Advanced Features: Taking Your Reports to the Next Level
For those looking to take their reports to the next level, Power BI Data Visualizations offers a variety of advanced features. For instance, Azure integration enables you to manage and analyze large datasets in the cloud, ensuring scalability. In addition, real-time data visualization ensures that your reports are always up to date, reflecting the most current data. With DAX for advanced calculations and Power BI Gateway to refresh data automatically, you can ensure that your reports stay accurate and relevant to your business needs.
Reporting and Dashboards: Bringing It All Together
Finally, Power BI allows you to create comprehensive reports and dashboards that provide a clear and actionable overview of your business’s performance. You can easily share these reports through the Power BI Service, ensuring that stakeholders have access to the insights they need. Whether you are creating operational dashboards or executive reports, Power BI ensures that your data is presented in a clear, accessible format.
Conclusion: Why Power BI is Essential for Your Data Strategy
In conclusion, Power BI is an essential tool for modern data analysis. With its powerful features for data preparation and modeling, diverse visualizations, and high interactivity, it supports data-driven decision-making at every level. Whether you’re new to Power BI or looking to optimize your current setup, mastering the features outlined in this guide will help you unlock the full potential of your data. By creating impactful reports and dashboards, you can drive smarter, faster decisions across your organization.
